Monitoring
Monitoring
Awanio Monitoring is an integrated monitoring feature that allows administrators to monitor the status, health, and performance of their entire Awanio infrastructure in real time through a graphical dashboard, enabling proactive management, faster troubleshooting, and optimal resource utilization across the entire infrastructure.
Through Awanio Monitoring, IT teams can view the condition of:
- Clusters
- Nodes
- Compute (VMs / workloads) in one centralized view, including key metrics such as CPU, memory, and storage.
This feature is designed to provide full visibility into infrastructure conditions, allowing potential issues to be detected early before they impact services.
Scope of Monitoring in Awanio
Awanio Monitoring includes three main layers:
Displays the overall status of the Awanio cluster, including:
- CPU and Memory Usage
- Storage Cluster Health (Healthy / Warning / Critical)
- Disk Performance and Usage
Provides a quick overview of whether the cluster is in a healthy and stable condition.

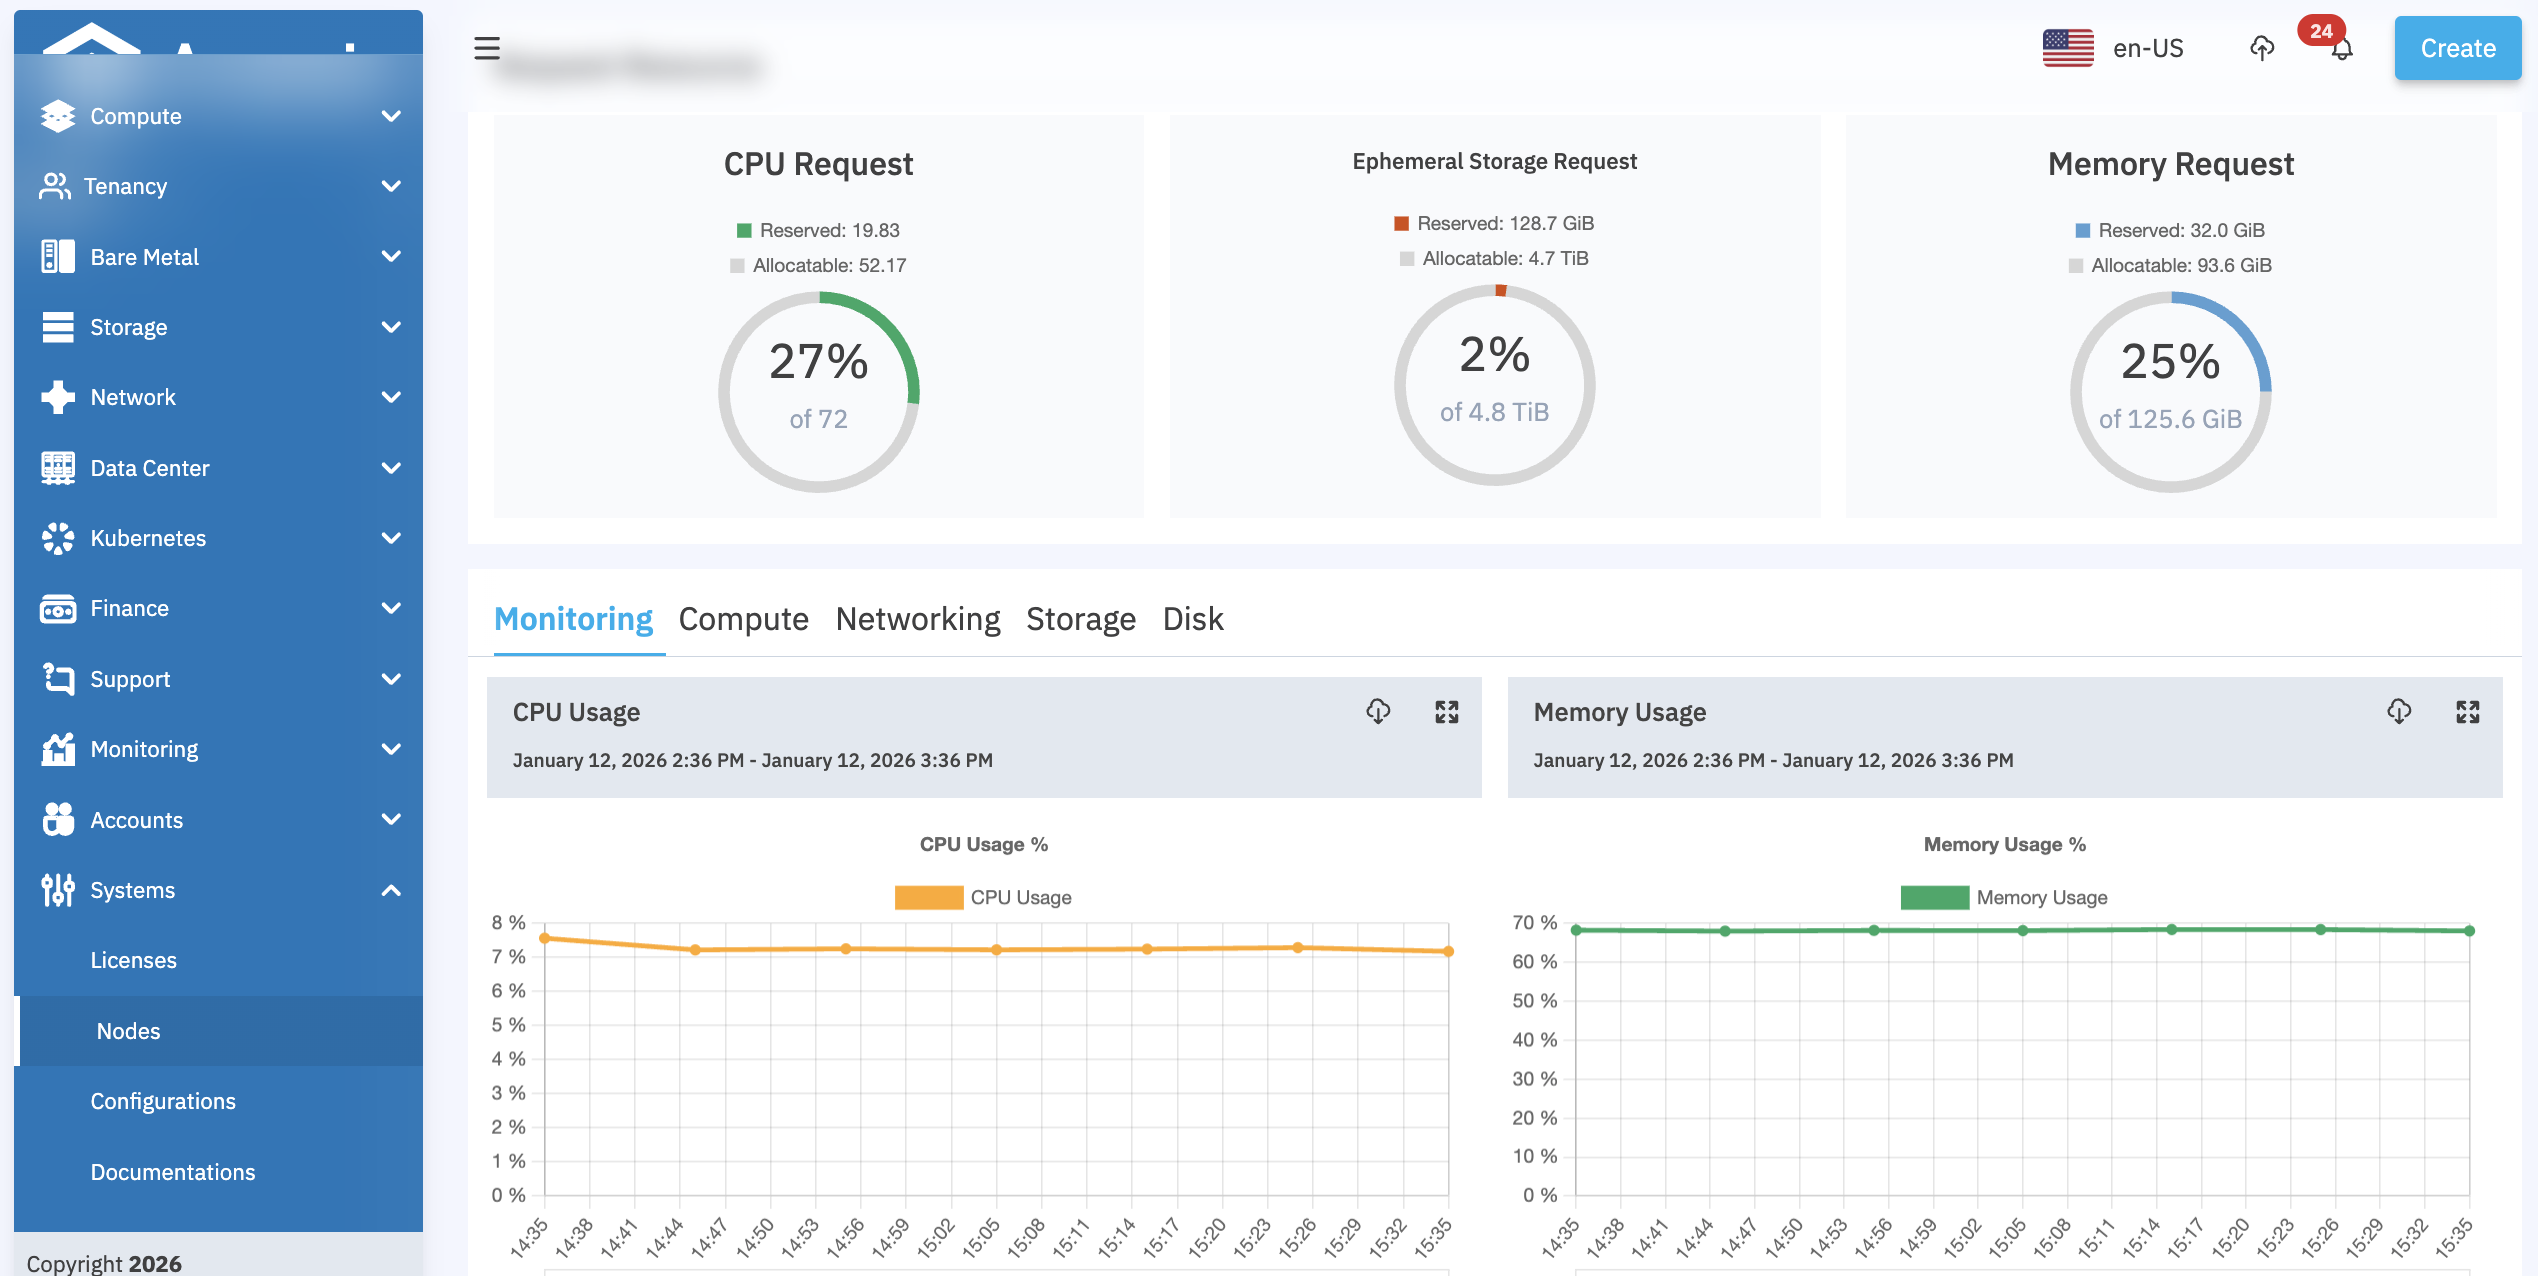
Displays the condition of each node in the cluster:
- Node status (Ready / Down)
- CPU, Memory, and Disk Usage
- Resource Requests
Administrators can immediately identify:
- Overloaded nodes
- Problematic nodes
- Unbalanced nodes
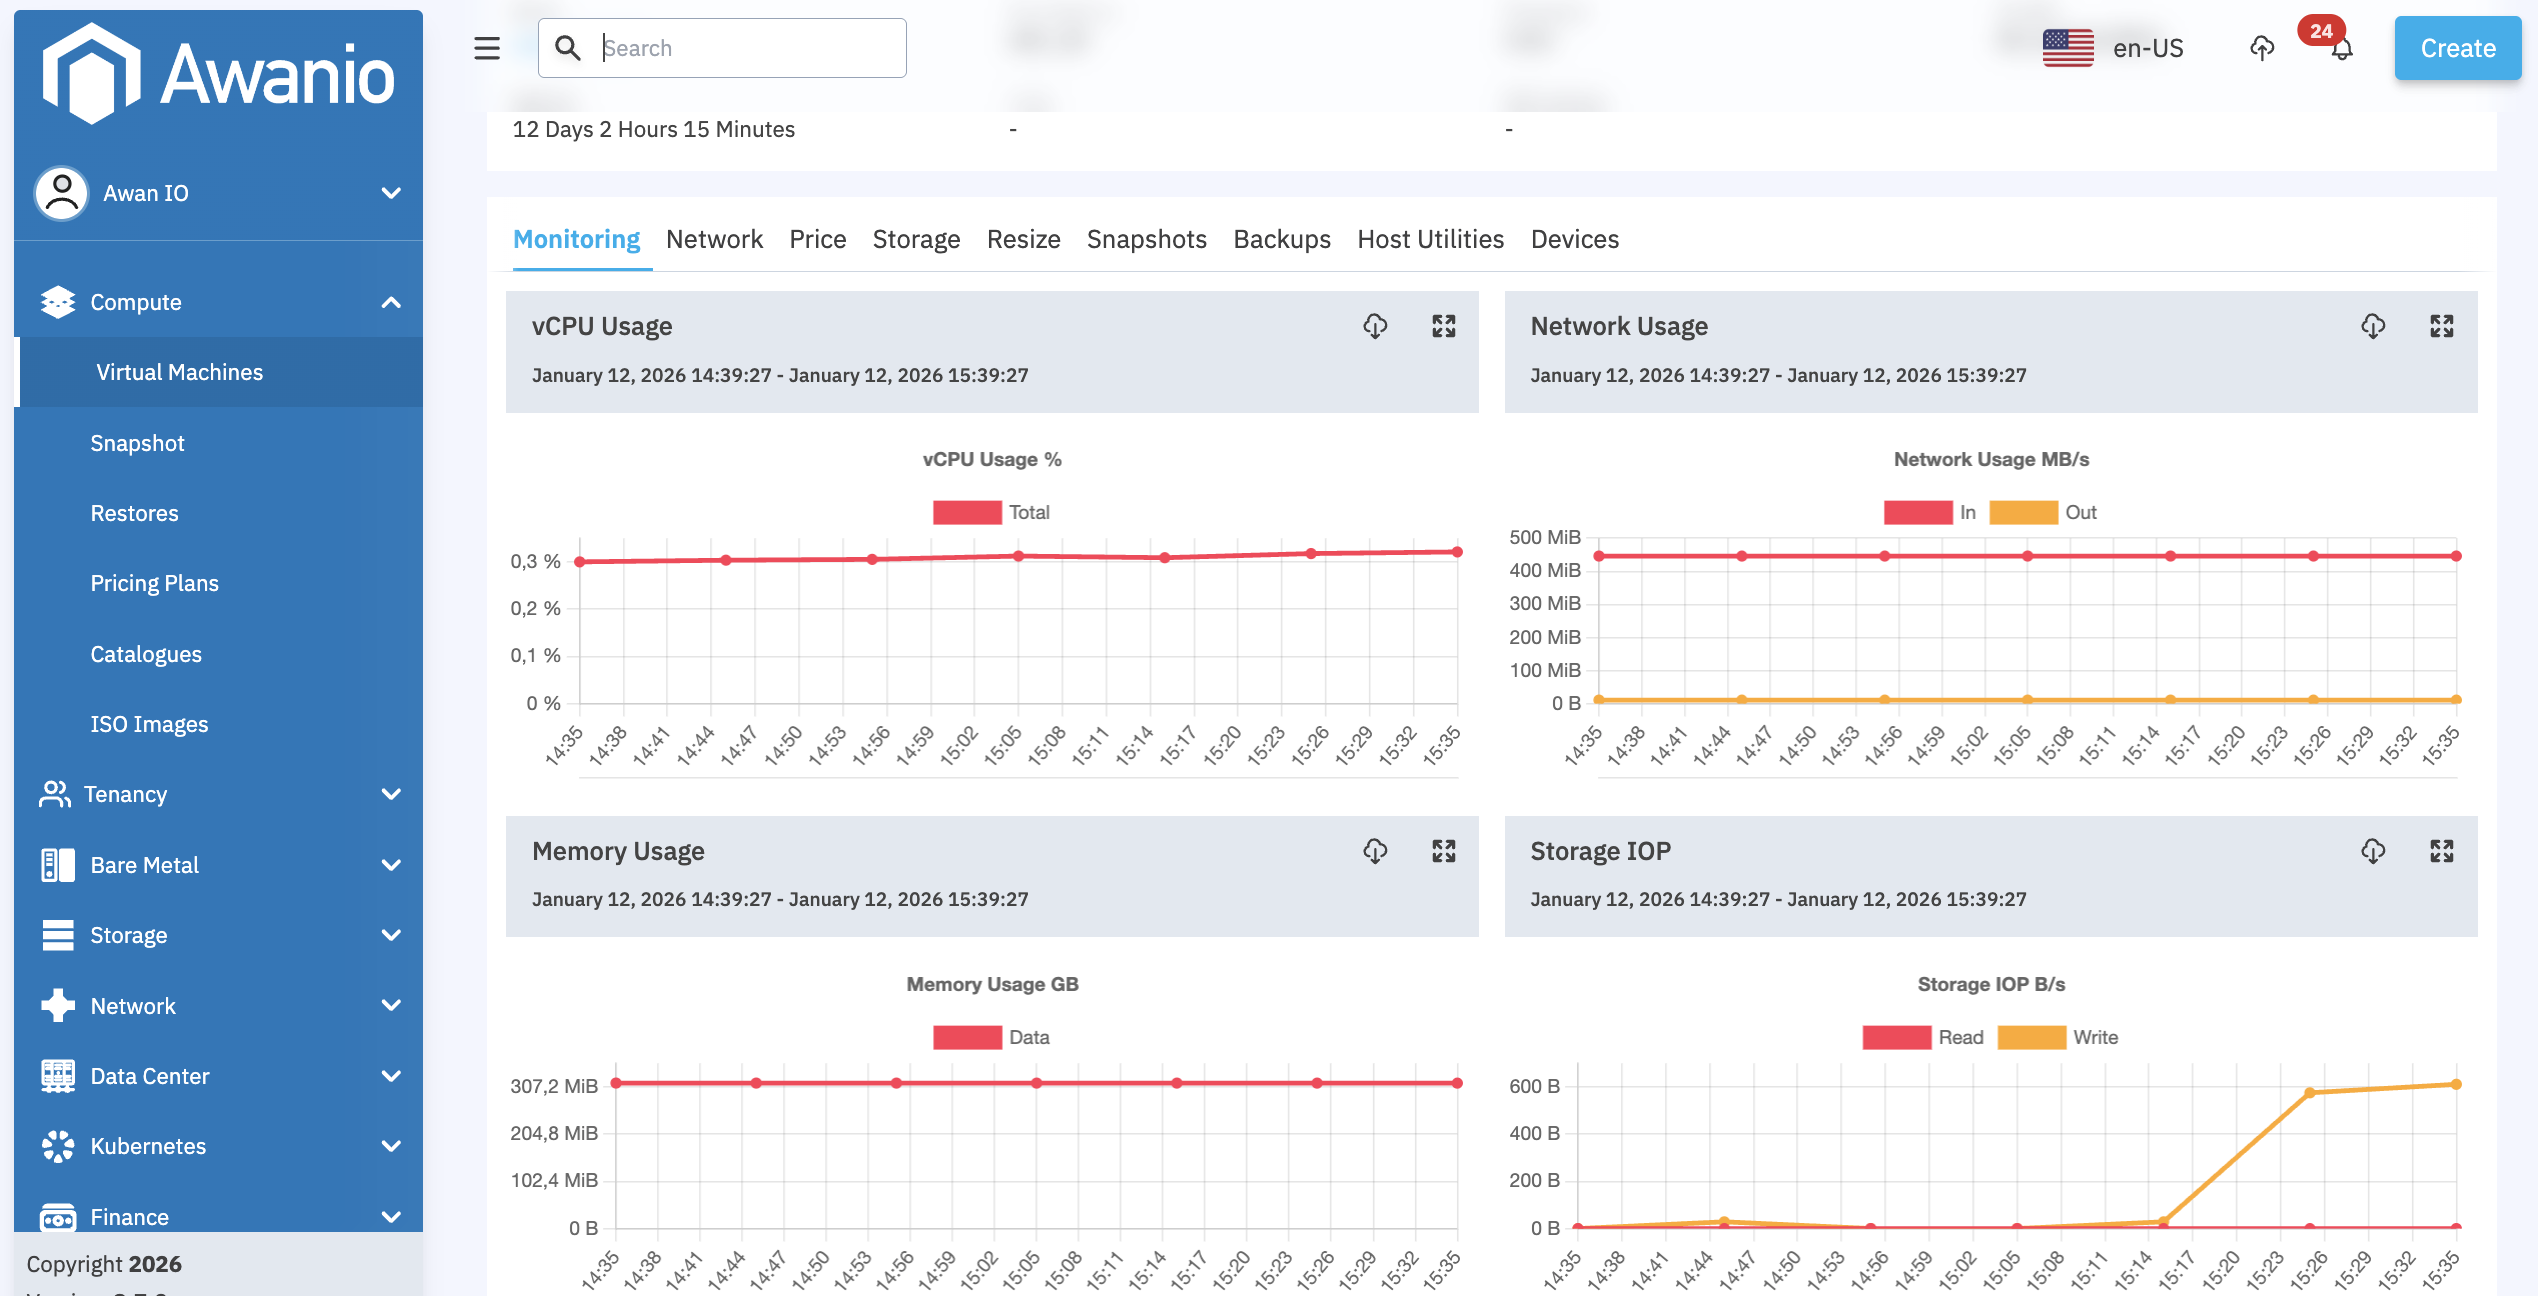
Displays details for each VM or workload:
- CPU utilization per VM
- Memory usage per VM
- Network usage per VM
- IOPS
- VM status (Running / Stopped / Error)
Helps troubleshooting directly on VMs.
Reporting
Usage charts for workloads can be saved in Excel or CSV for reporting purposes, with selectable periods.