

Cluster Overview
Kudashai supports Multi-Cluster Management. This means you can monitor and control K8s resources across various clusters (Development, Staging, Production) within a single centralized interface, without the need for manual context switching in the CLI.
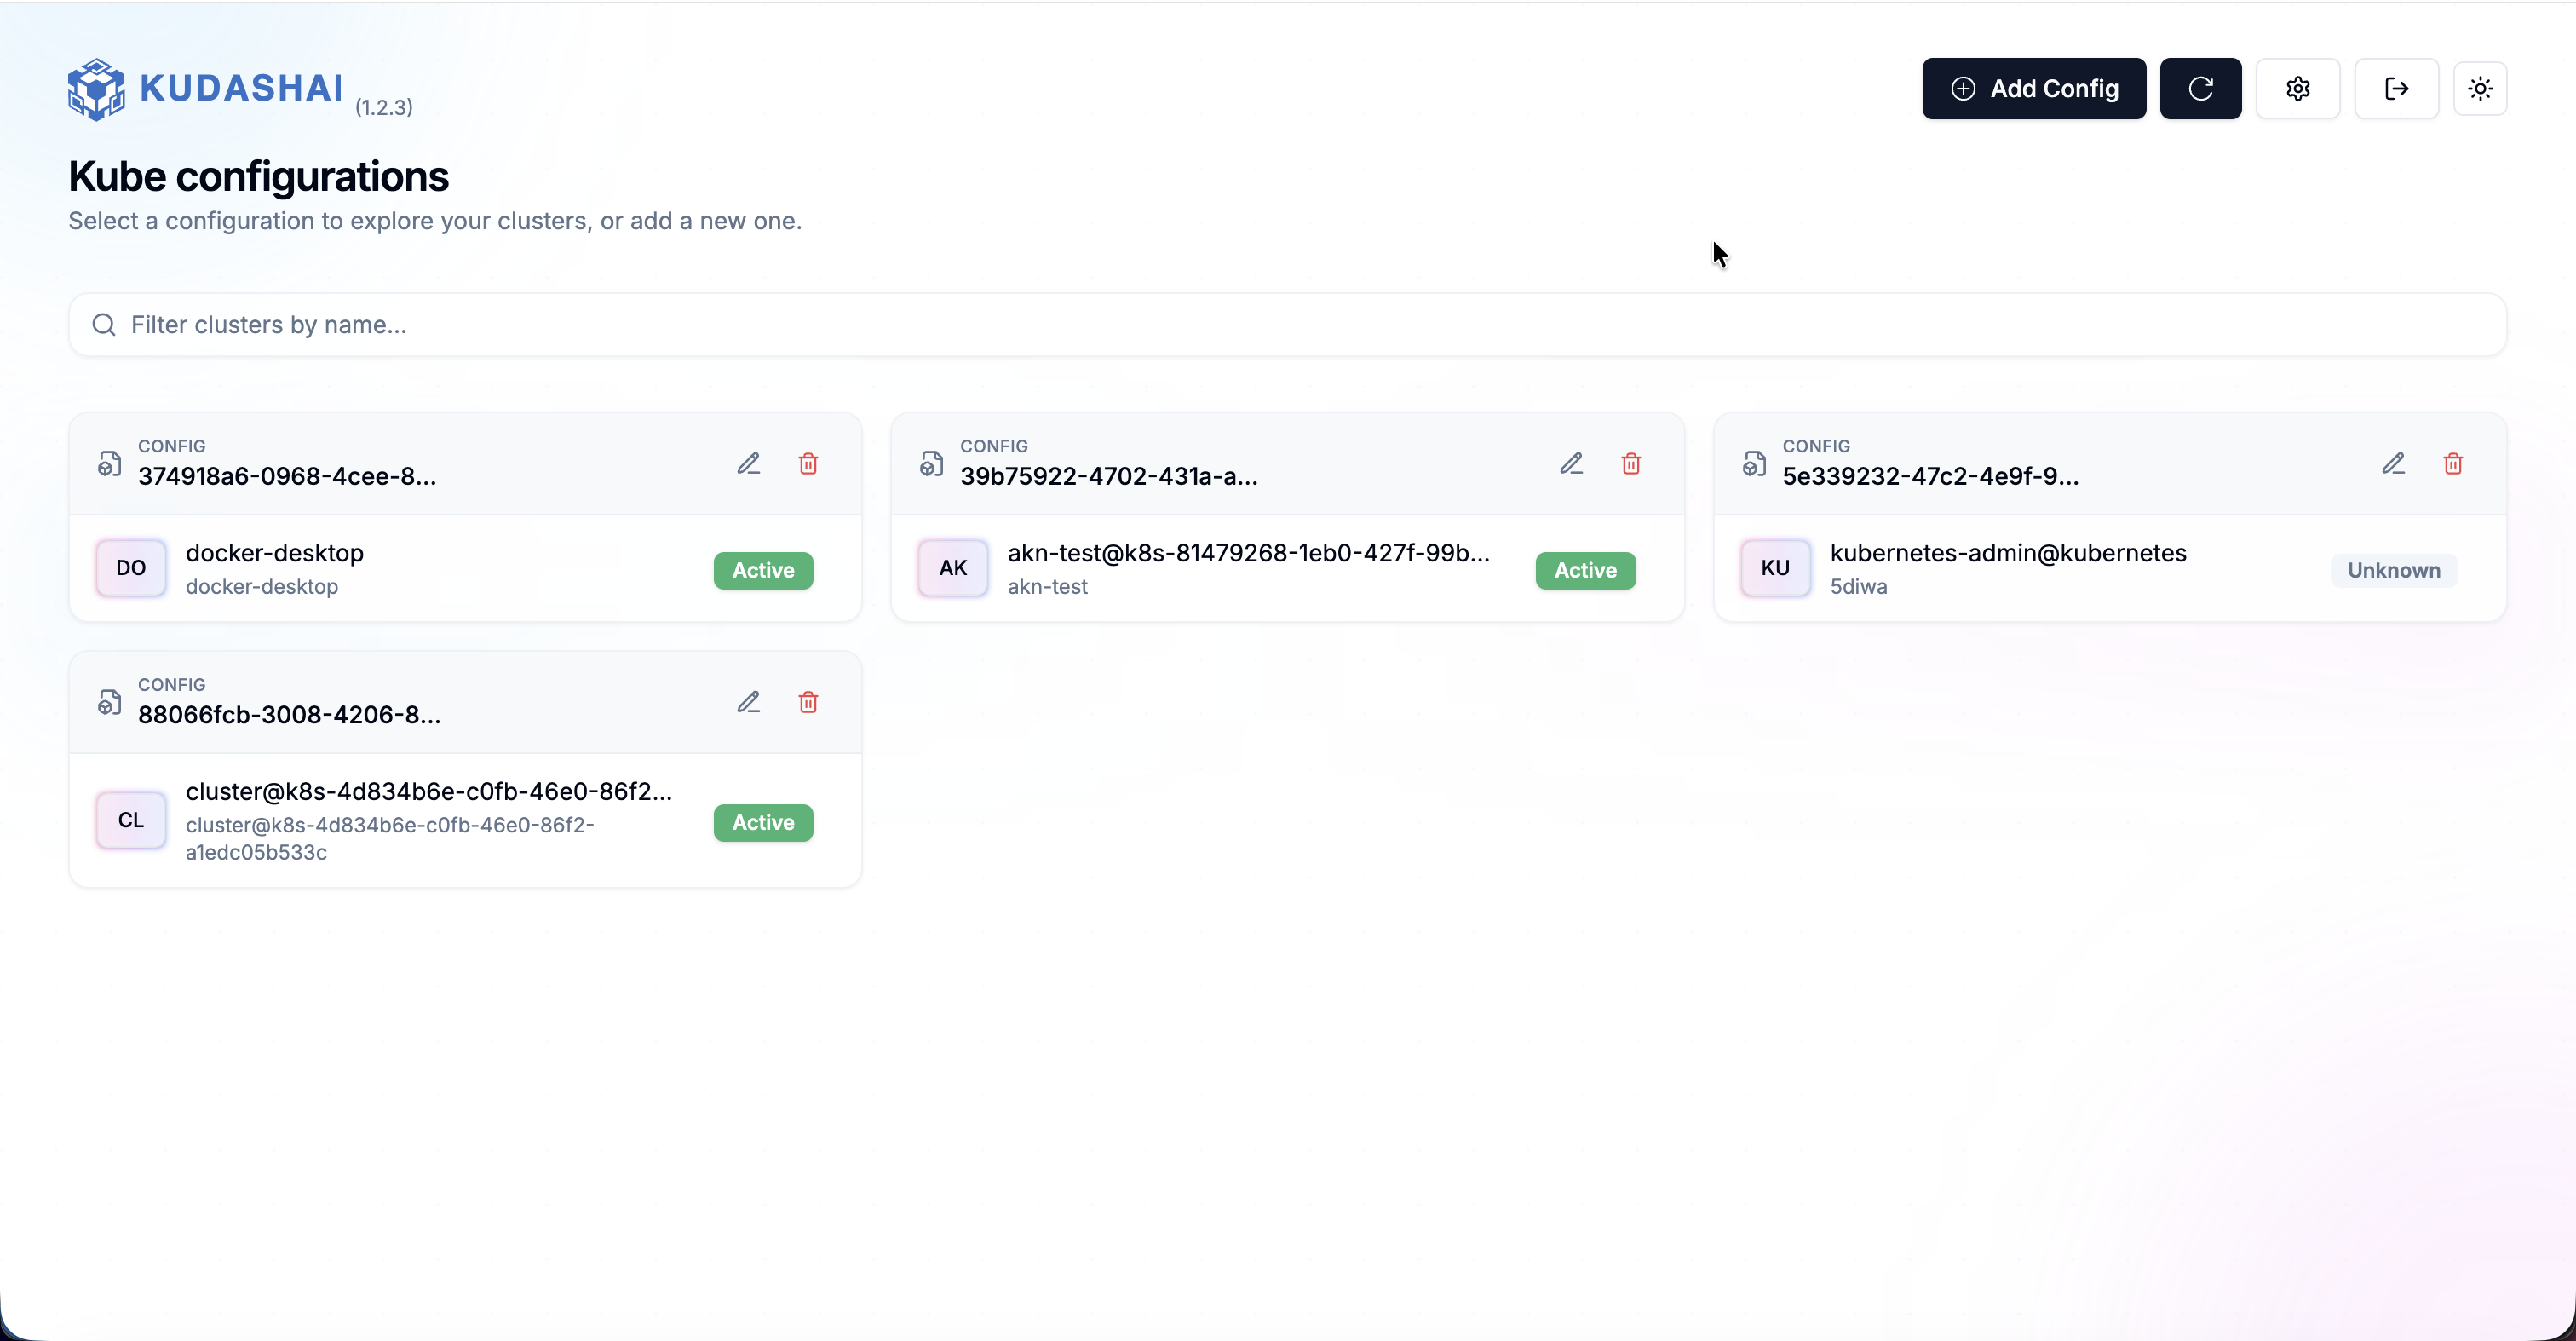
Adding a Cluster
There are several methods to add a new cluster to Kudashai:
- Auto-Discovery: Automatically imports kubeconfig configurations from the
~/.kube/configdirectory. - Kubeconfig Upload: Upload a specific Kubeconfig file.
- Bearer Token: Manually enter the API URL and Token.
- Certificate: Use certificate-based authentication (TLS certs).
- SSH Tunneling: Open a secure connection to clusters located inside a closed network (private subnet).
All cluster secrets and credentials are encrypted securely. In Standalone mode, Kudashai generates a secure local encryption key.
Real-Time Monitoring & Notifications
On each cluster's dashboard, you will see:
- Node and Pod health summaries.
- Resource usage (CPU / Memory).
- Recent event logs in real-time without needing to refresh the browser.
Early Warning Integration (Alerting)
Kudashai provides a Built-in Notification Integration that connects directly to Telegram (and soon Slack). If an anomaly occurs in the cluster—such as a Pod experiencing a memory failure (OOMKilled) or network issues—the system will instantly send a notification message to your operational Telegram group, complete with preliminary diagnostic details.