

Workload Management
Kudashai simplifies Kubernetes object management with a clean graphical interface.
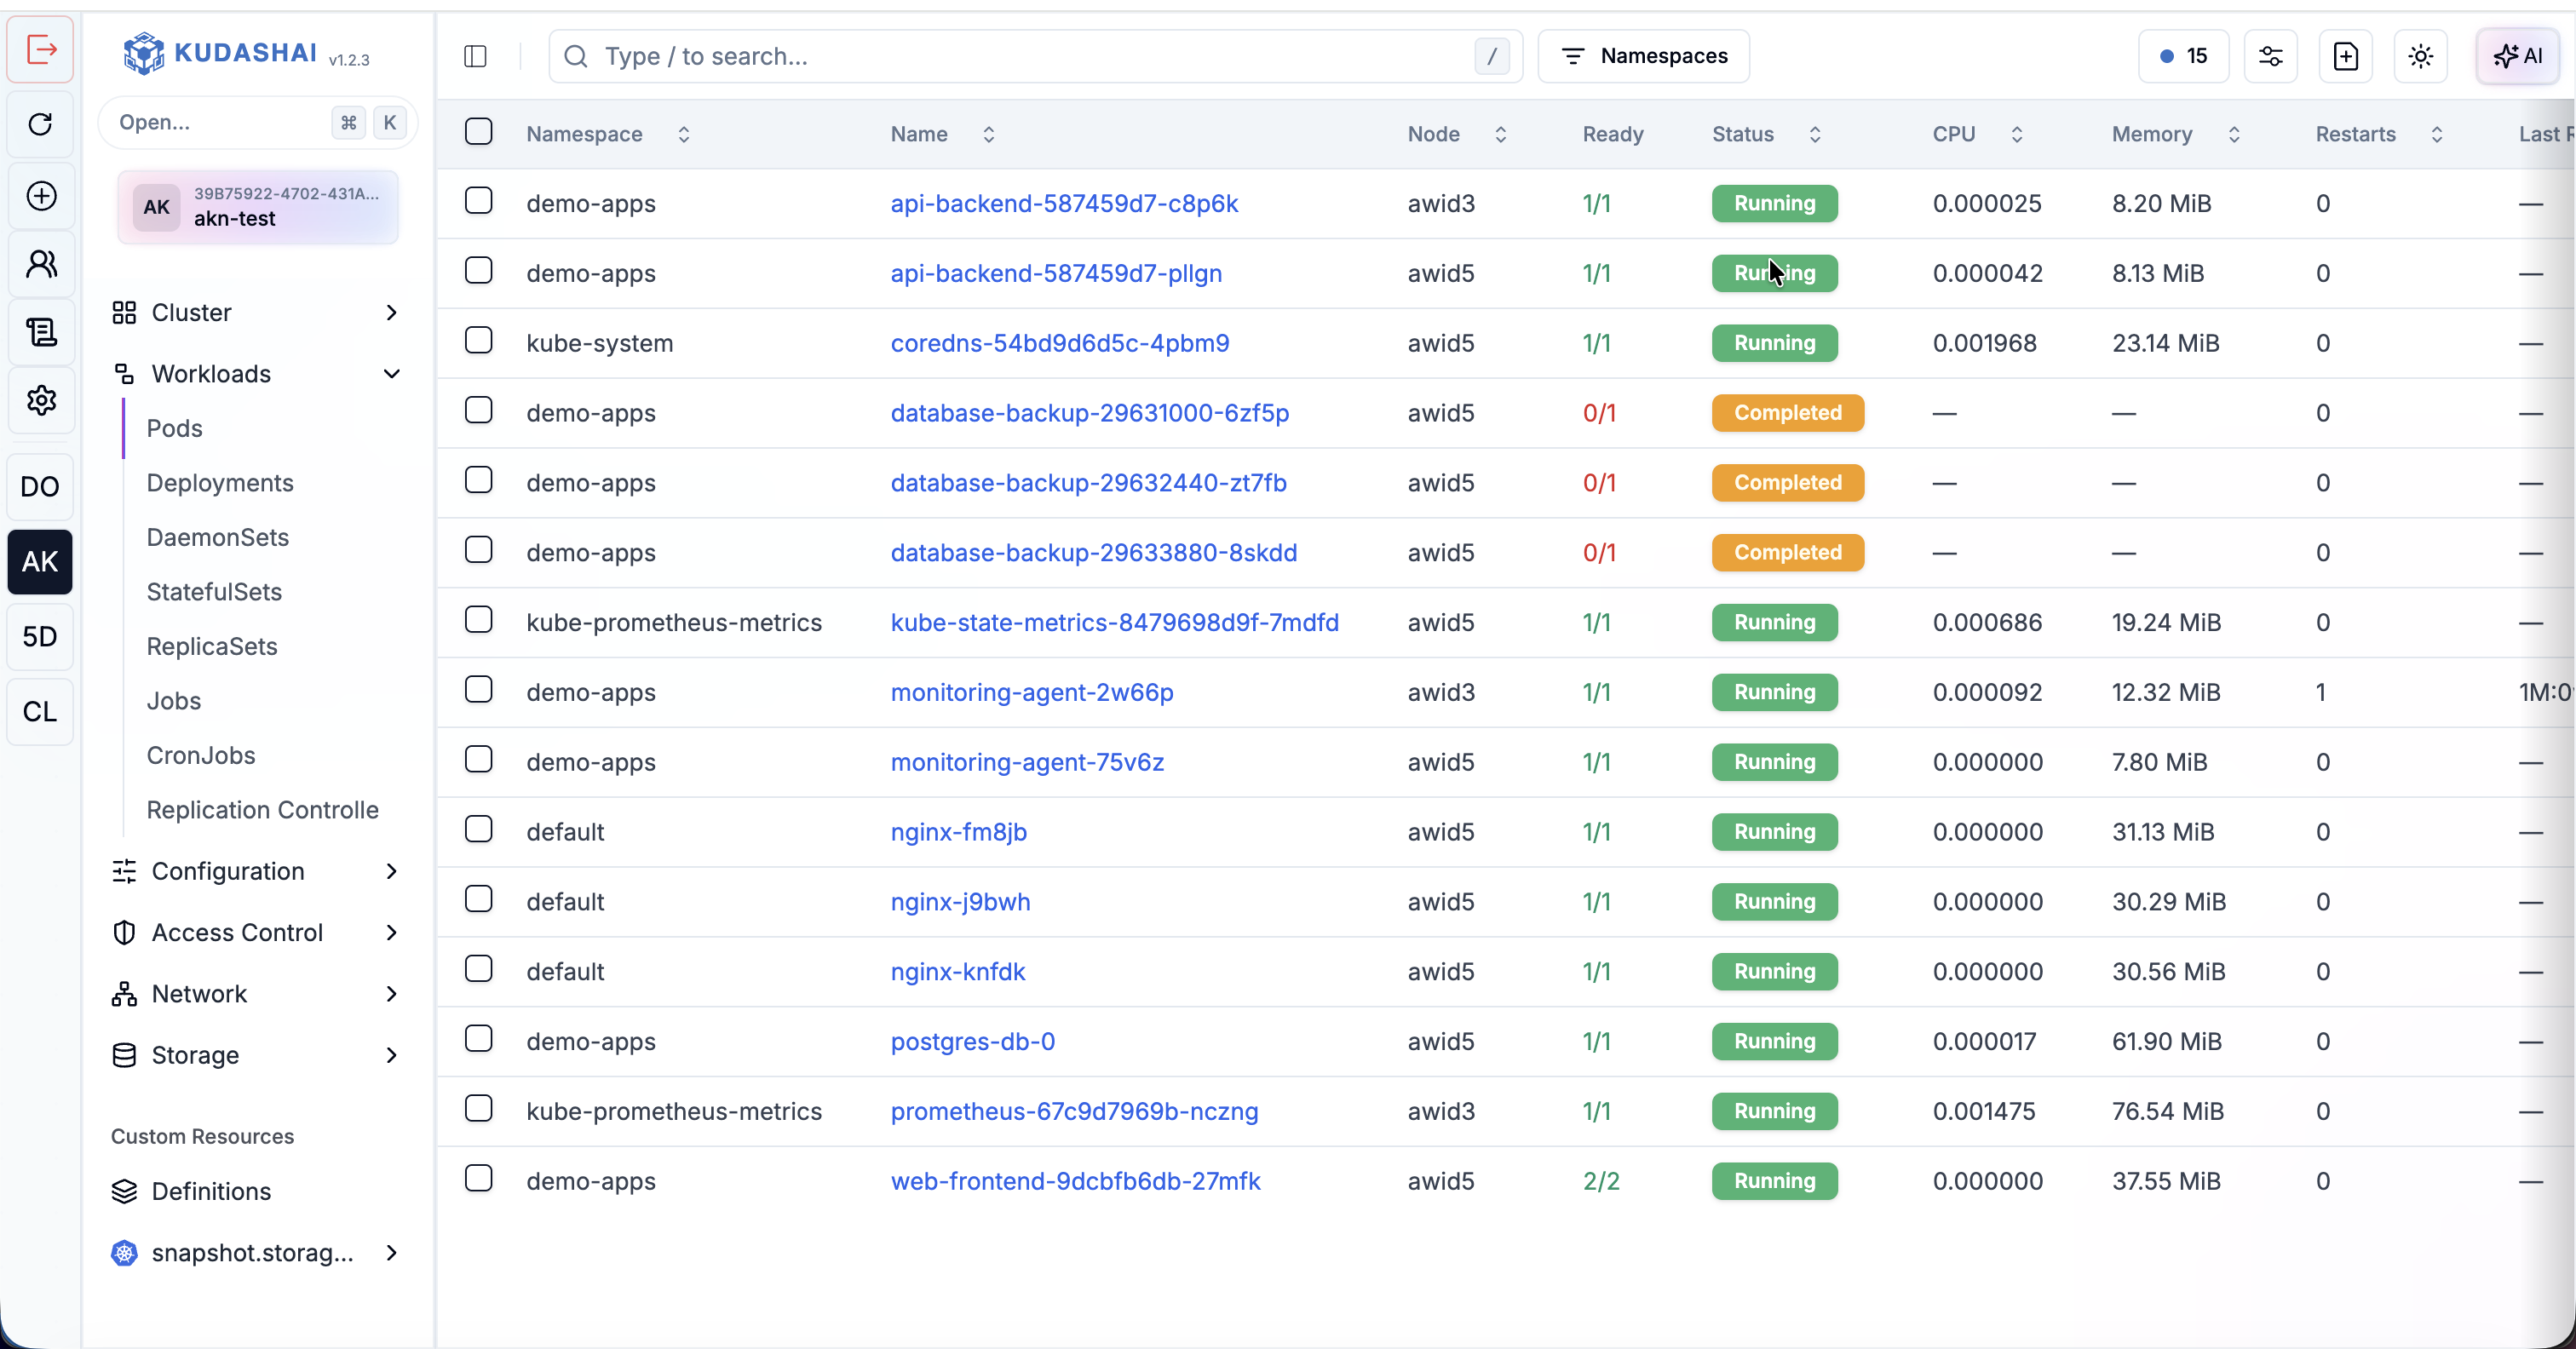
Resource Management
You can view detailed screens for:
- Deployments, StatefulSets, DaemonSets
- Pods and Jobs
- ConfigMaps and Secrets
Network Monitoring
In the Network category, Kudashai provides a dedicated interface for:
- Services: View the list of services, exposed ports, and their Selectors.
- Ingresses: Monitor all traffic routing rules. You can directly view a table containing Hosts (domain names), routing paths (Path), and configured TLS Hosts certificates, making it easy to track all domains pointing into your cluster.
Available one-click actions:
- Scale Deployments: Easily increase/decrease the number of replicas.
- Restart Pods: Execute a manual pod restart.
- Rollout Restarts: Force a deployment rollout to pick up the latest configuration.
- Apply Manifests: A built-in YAML editor to edit resource specs on-the-fly.
Pod Log Aggregation
The aggregated pod logs feature in Kudashai allows you to read tail logs from multiple pod replicas simultaneously. A real-time search and filter feature helps you locate errors in multi-replica applications.
Port Forwarding Feature (Desktop Exclusive)
For users running the Kudashai Desktop Application, you can access internal cluster services directly on your local machine using a secure, 1-click Port Forwarding feature. There's no need to type long CLI commands or manipulate YAML, which greatly accelerates your local debugging and application testing process.
(Note: This feature is hidden if you access Kudashai via a regular web browser, as it requires binding a network port directly to your local computer).